Table of Contents
Profilers
I use two profilers:
cProfile - https://docs.python.org/3/library/profile.html
line-profiler - https://pypi.org/project/line-profiler/
Requirements
python 3.10: module load itm-python/3.10
line-profiler : pip install line-profiler
gprof2dot : pip install gprof2dot
How to run?
- Prepare a standard launch
- Copy
python directory from /gss_efgw_work/work/g2fjc/jintrac/v220922/python to some location on pfs for example: /pfs/work/g2pbloch/python (I use paths with my username, change them to ones with your username) - Change
JINTRAC_PYTHON_DIR in rjettov (430 line) to python directory on pfs from step 2 - Change
run_python_driver (line 49) in /pfs/work/g2pbloch/python (I use paths with my username, change them to ones with your username): - cProfile :
mpirun --allow-run-as-root -np $NPROC python -u -m cProfile -o jintrac.prof /pfs/work/g2pbloch/python/jintrac_imas_driver.py mpi - line-profiler :
mpirun --allow-run-as-root -np $NPROC python -u -m kernprof -l /pfs/work/g2pbloch/python/jintrac_imas_driver.py mpi When we use line-profiler we must add wrapper to profiling function. In this case we should add @profile upper jintrac_imas_driver function in jintrac_imas_driver.py :
| Code Block |
|---|
| language | py |
|---|
| title | function wrapper |
|---|
|
@profile
def jintrac_imas_driver(params, components, mpi='no'):

"""JINTRAC-IMAS generic workflow driver.""" |
- Run
./rjettov -S -I -p -x64 test v220922 g2fjc
cProfile analysis
To read data from test.prof we need python script. We can use e.g.
| Code Block |
|---|
| language | py |
|---|
| title | cprofile_script.py |
|---|
|
import pstats
stats = pstats.Stats('test.prof')
stats.strip_dirs().sort_stats(pstats.SortKey.TIME).print_stats() |
This script print data sorted by tottime column ( In tottime column is total time spent in the given function (and excluding time made in calls to sub-functions)). These are the first few lines of the result:
| Code Block |
|---|
   Wed Nov 30 09:40:33 2022    test.prof

         19379745 function calls (19376063 primitive calls) in 164.514 seconds

   Ordered by: internal time

   ncalls  tottime  percall  cumtime  percall filename:lineno(function)
        3   81.304   27.101   81.304   27.101 {imas_3_37_0_ual_4_11_0._ual_lowlevel.ual_open_pulse}
  2891220   42.947    0.000   52.709    0.000 {imas_3_37_0_ual_4_11_0._ual_lowlevel.ual_read_data_array}
  2497358   16.127    0.000   16.127    0.000 {imas_3_37_0_ual_4_11_0._ual_lowlevel.ual_read_data_scalar}
  2899948    2.784    0.000    2.784    0.000 {built-in method numpy.zeros}
   815194    2.391    0.000    2.391    0.000 {method 'reduce' of 'numpy.ufunc' objects}
   427578    1.225    0.000    2.589    0.000 fromnumeric.py:38(_wrapit)
   815196    1.015    0.000    7.988    0.000 {built-in method numpy.core._multiarray_umath.implement_array_function}
   387616    0.876    0.000    2.809    0.000 fromnumeric.py:69(_wrapreduction)
   427578    0.848    0.000    0.848    0.000 {method 'reshape' of 'numpy.ndarray' objects}
   427578    0.685    0.000    3.358    0.000 fromnumeric.py:51(_wrapfunc)
387785 0.684 0.000 0.684 0.000 {method 'items' of 'dict' objects} |
Complete file is below:
| View file |
|---|
| name | cProfile_result.txt |
|---|
| height | 250 |
|---|
|
We can also make an image from data:
- Install gprof2dot :
pip install gprof2dot - run :
python -m gprof2dot -f pstats test.prof | dot -Tsvg -o output.svg
Example image looks like this ( output.svg is simplified image, output1.svg is complete image with full data):
Line-profiler analysis
To read data from jintrac_imas_driver.py.lprof run:
-
python -m line_profiler jintrac_imas_driver.py.lprof .
These are the first few lines of the results :
| Code Block |
|---|
| title | line-profiler result |
|---|
|
Timer unit: 1e-06 s

Total time: 232.892 s
File: /pfs/work/g2pbloch/python/jintrac_imas_driver.py
Function: jintrac_imas_driver at line 721

Line #      Hits         Time  Per Hit   % Time  Line Contents
==============================================================
   721                                           @profile
   722                                           def jintrac_imas_driver(params, components, mpi='no'):
   723
   724                                               """JINTRAC-IMAS generic workflow driver."""
   725
   726                                               # Workflow configuration parameters
   727
   728         1          5.9      5.9      0.0      user_in = wf.string(params, "Input IDS user")
   729         1          2.3      2.3      0.0      machine_in = wf.string(params, "Input IDS machine")
   730         1          4.7      4.7      0.0      shot_in = wf.integer(params, "Input IDS shot")
   731         1          2.1      2.1      0.0      run_in = wf.integer(params, "Input IDS run")
   732         1          2.9      2.9      0.0      user_out = wf.string(params, "Output IDS user")
   733         1          2.6      2.6      0.0      machine_out = wf.string(params, "Output IDS machine")
   734         1          2.6      2.6      0.0      shot_out = wf.integer(params, "Output IDS shot")
   735         1          2.6      2.6      0.0      run_out = wf.integer(params, "Output IDS run")
736 1 13.3 13.3 0.0 user_tmp = os.environ['HOME']+'/public/tempdb' |
Complete file is below:
| View file |
|---|
| name | line_profiler_result.txt |
|---|
| height | 250 |
|---|
|
Key lines from the results:
| Code Block |
|---|
| title | Key lines from line-profiler |
|---|
|
Line #      Hits         Time  Per Hit   % Time  Line Contents
   895         1   62545203.7 62545203.7     26.9      alenv = ALEnv(user_temp=user_tmp)
   917        22   49496025.7 2249819.4     21.3                  ids_bundle_input[ids_struct] = eval('DBentry.idsin.get("'+ids_struct+'")')
   922         1   83745046.9 83745046.9     36.0      tmpdict = bundle_copy(ids_bundle_input)
   956         2    4665617.1 2332808.6      2.0                          ids_bundle_input[elem] = DBentry.idsin.get_slice(elem, tstart, 3)
   966         1    6353190.5 6353190.5      2.7      ids_bundle_work = bundle_copy(ids_bundle_input)
   967         1    7884627.8 7884627.8      3.4      ids_bundle_updated = bundle_copy(ids_bundle_input)
1022 3 14539266.0 4846422.0 6.2 ids_bundle_prev[item] = bundle_copy(ids_bundle_work,imas_control.get_ids_sublist_updates(item)) |
Candidates for bottlenecks
From cProfile result can see that 85% execution time jintrac_imas_driver.py spend on imas functions. Function ual_open_pulse was called only 3 times. It execution time is 27s. Functions ual_read_data_array and ual_read_data_scalar was called more than 2 milions times.
From line-profiler we can see, that jintrac_imas_driver.py spends a lot of time in lins with functioin bundle_copy. This function call imas functions. A lot of time is also taken up by functions calls with DBentry.
Possible ways to speed up jintrac_imas_driver.py:
Reducing number of calls: ual_open_pulse, ual_read_data_array, ual_read_data_scalar
Summary of July Profiling (HFD5)
Instruction
| Code Block |
|---|
| title | JINTRAC version to use with HDF5 (latest AL) on GW |
|---|
|
module use /pfs/work/g2fjc/jintrac/v120523/modules
module load jintrac
export JINTRAC_IMAS_BACKEND=HDF5
module use /pfs/g2fjc/cmg/jams/v230123/modules
module load jams
(Create test case data)
idscp -u g2pmanas --database west -si 54762 -so 54762 -ri 123 -ro 123 -bo HDF5
(path)
/pfs/work/g2fjc/jetto/runs/runmemleak_v120523_np1_z0_1ms |
Line Profiler
Key lines from the results:
| Code Block |
|---|
| title | Key lines from the results |
|---|
|
Timer unit: 1e-06 s
Total time: 155.404 s
File: /pfs/work/g2pbloch/jintrac/python/jintrac_imas_driver.py
Function: jintrac_imas_driver at line 735

Line #      Hits         Time  Per Hit   % Time  Line Contents
==============================================================
   957        22   44253622.5 2011528.3     28.5           ids_bundle_input[ids_struct] = eval('DBentry.idsin.get("'+ids_struct+'")')
   962         1   46906374.5 46906374.5     30.2          tmpdict = bundle_copy(ids_bundle_input)
   996         2    5116586.7 2558293.3      3.3           ids_bundle_input[elem] = DBentry.idsin.get_slice(elem, tstart, interp_value)
  1011         1    3447098.9 3447098.9      2.2           ids_bundle_work = bundle_copy(ids_bundle_input)
  1012         1    4400338.9 4400338.9      2.8           ids_bundle_updated = bundle_copy(ids_bundle_input)
  1067         3    6886544.4 2295514.8      4.4           ids_bundle_prev[item] = bundle_copy(ids_bundle_work,imas_control.get_ids_sublist_updates(item))
  1099         3   29669430.5 9889810.2     19.1           ids_bundle_updated_tmp = eval(imas_control.get_wrapper(item) + args)
  1105        11    4863627.8 442148.0      3.1            ids_bundle_updated[ids_struct].copyValues(ids_bundle_updated_tmp[ids_struct])
  1106        11    3643527.1 331229.7      2.3            ids_bundle_prev[item][ids_struct].copyValues(ids_bundle_updated_tmp[ids_struct])
  1114         1    4798639.4 4798639.4      3.1           ids_bundle_work = bundle_copy(ids_bundle_updated)


Total time: 12.4112 s
File: /pfs/work/g2pbloch/jintrac/python/jintrac_imas_driver.py
Function: jetto_wrapper at line 304
Line #      Hits         Time  Per Hit   % Time  Line Contents
==============================================================
   323         1          0.7      0.7      0.0      out_prof, out_src, out_trans, out_equil, out_summ, out_num, out_work \
   324         1    8768238.1 8768238.1     70.6                = jetto(in_prof, in_src, in_trans, in_equil, in_nbi,
   325         1          0.3      0.3      0.0                        in_pel, in_pulse, in_contr, in_summ, in_num, in_work)
367 1 3589306.4 3589306.4 28.9 out_ids_bundle = bundle_copy(in_ids_bundle_work) |
Complete file is below:
| View file |
|---|
| name | line_profiler_result.txt |
|---|
| height | 250 |
|---|
|
cProfiler
| Code Block |
|---|
| title | Key lines from the results |
|---|
|
Wed Jul  5 09:31:02 2023    jintrac.prof

         207387232 function calls (178651380 primitive calls) in 151.148 seconds

   Ordered by: internal time

   ncalls  tottime  percall  cumtime  percall filename:lineno(function)
26076870/927   40.102    0.000   82.859    0.089 copy.py:128(deepcopy)
  3356451   24.272    0.000   36.639    0.000 {imas_3_38_1_ual_4_11_4._ual_lowlevel.ual_read_data_array}
778014/927    9.056    0.000   82.841    0.089 copy.py:227(_deepcopy_dict)
 53709341    7.111    0.000    7.111    0.000 {method 'get' of 'dict' objects}
        1    5.916    5.916    7.367    7.367 wrapper.py:48(jetto_actor)
  2959395    4.441    0.000    4.441    0.000 {imas_3_38_1_ual_4_11_4._ual_lowlevel.ual_read_data_scalar}
  4441187    4.234    0.000    4.234    0.000 {method '__deepcopy__' of 'numpy.ndarray' objects}
1556028/927    4.081    0.000   82.851    0.089 copy.py:259(_reconstruct)
  7099231    3.948    0.000    5.721    0.000 copy.py:243(_keep_alive)
 35834998    3.774    0.000    3.774    0.000 {built-in method builtins.id}
  3398693    3.110    0.000    3.110    0.000 {built-in method numpy.zeros}
  1005851    3.045    0.000    3.045    0.000 {method 'reduce' of 'numpy.ufunc' objects}
 18974180    2.106    0.000    2.106    0.000 copy.py:182(_deepcopy_atomic)
  1556028    1.918    0.000    1.921    0.000 {method '__reduce_ex__' of 'object' objects}
  8578377    1.660    0.000    1.660    0.000 {built-in method builtins.getattr}
   134159    1.607    0.000    1.607    0.000 {imas_3_38_1_ual_4_11_4._ual_lowlevel.ual_begin_arraystruct_action}
   509900    1.504    0.000    3.231    0.000 fromnumeric.py:38(_wrapit)
  1005853    1.383    0.000   10.248    0.000 {built-in method numpy.core._multiarray_umath.implement_array_function}
        1    1.212    1.212  151.202  151.202 jintrac_imas_driver.py:1(<module>)
  1274146    1.140    0.000    1.140    0.000 {method 'items' of 'dict' objects}
   495951    1.116    0.000    3.696    0.000 fromnumeric.py:69(_wrapreduction)
509900 1.051 0.000 1.051 0.000 {method 'reshape' of 'numpy.ndarray' objects} |
Complete file is below:
| View file |
|---|
| name | cprofile_result.txt |
|---|
| height | 250 |
|---|
|
Possible bottlenecks
- Process of copying data (
bundle_copy , copyValues ). eval(imas_control.get_wrapper(item) + args) and eval(imas_control.get_wrapper(item) + args) take almost half of function time
Testing HDF5
HDF5_BACKEND_READ_CACHE - TABLE
| Markdown |
|---|
|HDF5_BACKEND_READ_CACHE [MB]   |jintrac_imas_driver |jetto_wrapper |jintrac_imas_driver |jetto_wrapper|
|getslice interpolation| off | off| on |on |
|----------|------------|------------|-----------|-------------|
|   4 | 241.739 | 12.9481 | 230.008 | 12.136  |
|   8 | 234.774 | 12.3213 | 228.837 | 12.1292 |
|  12 | 168.333 | 13.0729 | 148.889 | 12.0893 |
|  16 | 154.656 | 12.3905 | 152.87  | 12.3117 |
|  20 | 152.988 | 12.4138 | 155.945 | 12.4595 |
|  24 | 150.913 | 12.283  | 155.469 | 12.7765 |
|  28 | 153.991 | 12.5123 | 153.11  | 12.3468 |
|  32 | 153.903 | 12.4356 | 149.575 | 12.1548 |
|  36 | 159.225 | 12.6422 | 151.492 | 12.1888 |
|  40 | 149.549 | 12.2838 | 152.926 | 12.207  |
|  44 | 158.385 | 12.5754 | 154.827 | 12.266  |
|  48 | 153.306 | 12.3843 | 152.786 | 12.3101 |
|  52 | 150.771 | 12.3464 | 151.305 | 12.1539 |
|  56 | 165.846 | 13.0865 | 153.383 | 12.2905 |
|  60 | 153.729 | 12.6542 | 155.563 | 12.4427 |
|  64 | 161.231 | 12.5552 | 151.229 | 12.2685 |
|  68 | 154.142 | 12.4402 | 148.697 | 12.0926 |
|  72 | 153.52  | 12.4294 | 149.757 | 12.1072 |
|  76 | 149.982 | 12.3277 | 151.765 | 12.2017 |
|  80 | 155.473 | 12.6245 | 151.903 | 12.2647 |
|  84 | 150.118 | 12.2872 | 152.894 | 12.2489 |
|  88 | 149.918 | 12.2017 | 154.456 | 12.285  |
|  92 | 151.403 | 12.317  | 149.207 | 12.0798 |
|  96 | 150.825 | 12.3905 | 152.792 | 12.2197 |
| 100 | 149.834 | 12.6997 | 147.859 | 12.0551 |
| 104 | 150.326 | 12.3421 | 148.031 | 12.062  |
| 108 | 151.51  | 12.3496 | 152.049 | 12.2785 |
| 112 | 155.506 | 12.4702 | 154.526 | 12.3407 |
| 116 | 153.662 | 12.4152 | 153.498 | 12.2769 |
| 120 | 158.311 | 12.7339 | 148.607 | 12.1153 |
| 124 | 154.864 | 12.2361 | 156.592 | 12.5044 |
| 128 | 153.5   | 12.2201 | 154.231 | 13.1112 |
| 132 | 152.191 | 12.3723 | 156.739 | 12.4632 |
| 136 | 160.911 | 12.5815 | 152.368 | 12.3718 |
| 140 | 159.165 | 12.8561 | 149.531 | 12.1498 |
| 144 | 153.646 | 12.4145 | 151.239 | 12.1133 |
| 148 | 149.434 | 12.3417 | 147.887 | 11.9921 |
| 152 | 151.505 | 12.3484 | 151.848 | 12.4215 |
| 156 | 151.068 | 12.3288 | 156.421 | 12.4458 |
| 160 | 152.951 | 12.4558 | 155.213 | 12.4617 |
| 164 | 149.566 | 12.2848 | 151.589 | 12.2744 |
| 168 | 151.872 | 12.4422 | 151.654 | 12.4456 |
| 172 | 152.766 | 12.4294 | 153.34  | 12.2264 |
| 176 | 151.982 | 12.4162 | 149.911 | 12.254  |
| 180 | 152.768 | 12.4248 | 156.015 | 12.3302 |
| 184 | 148.166 | 12.2076 | 149.323 | 12.2971 |
| 188 | 153.493 | 12.4229 | 153.415 | 13.0557 |
| 192 | 153.968 | 12.3694 | 157.029 | 12.4348 |
| 196 | 152.465 | 12.3764 | 154.288 | 12.2881 |
| 200 | 149.238 | 12.2266 | 154.713 | 12.3013 | |
HDF5_BACKEND_READ_CACHE - PLOTS
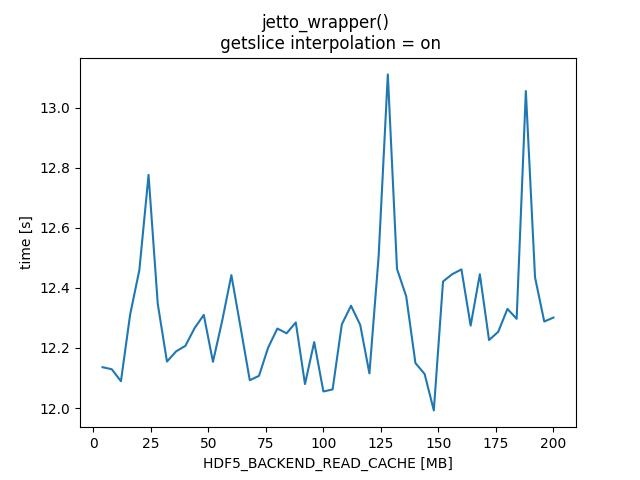 Image Modified
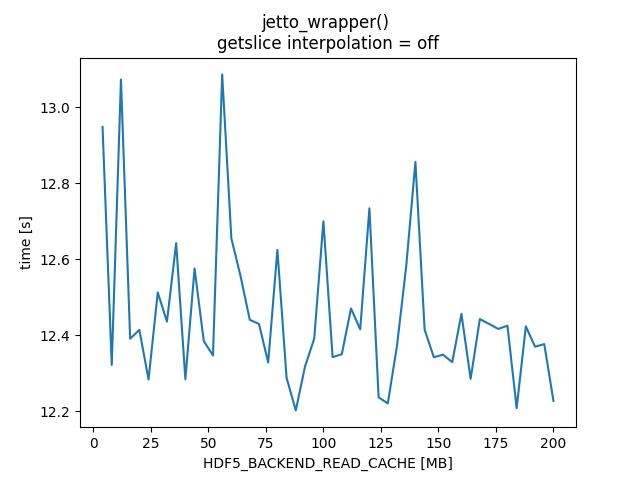 Image Modified
 Image Modified
 Image Modified
TESTING MDSPLUS
LINE PROFILER
| Code Block |
|---|
|
Timer unit: 1e-06 s

Total time: 155.743 s
File: /pfs/work/g2pbloch/jintrac/python/jintrac_imas_driver.py
Function: jintrac_imas_driver at line 735

Line #      Hits         Time  Per Hit   % Time  Line Contents
==============================================================
   896         1    1638364.1 1638364.1      1.1                  status, idx_out = DBentry.idsout.create()  # idx_out points to output IDS file index
   957        22   50742304.5 2306468.4     32.6                      ids_bundle_input[ids_struct] = eval('DBentry.idsin.get("'+ids_struct+'")')
   962         1   45878227.2 45878227.2     29.5          tmpdict = bundle_copy(ids_bundle_input)
   996         2    3193050.2 1596525.1      2.1                              ids_bundle_input[elem] = DBentry.idsin.get_slice(elem, tstart, interp_value)
  1011         1    3399663.8 3399663.8      2.2      ids_bundle_work = bundle_copy(ids_bundle_input)
  1012         1    4340984.3 4340984.3      2.8      ids_bundle_updated = bundle_copy(ids_bundle_input)
  1067         3    6779104.9 2259701.6      4.4          ids_bundle_prev[item] = bundle_copy(ids_bundle_work,imas_control.get_ids_sublist_updates(item))
  1199         3   25454536.5 8484845.5     16.3                  ids_bundle_updated_tmp = eval(imas_control.get_wrapper(item) + args)
  1105        11    4817487.6 437953.4      3.1                              ids_bundle_updated[ids_struct].copyValues(ids_bundle_updated_tmp[ids_struct])
  1106        11    3587909.3 326173.6      2.3                              ids_bundle_prev[item][ids_struct].copyValues(ids_bundle_updated_tmp[ids_struct])
  1114         1    4769085.3 4769085.3      3.1          ids_bundle_work = bundle_copy(ids_bundle_updated)

Total time: 12.4592 s
File: /pfs/work/g2pbloch/jintrac/python/jintrac_imas_driver.py
Function: jetto_wrapper at line 304

Line #      Hits         Time  Per Hit   % Time  Line Contents
==============================================================
   323         1          1.3      1.3      0.0      out_prof, out_src, out_trans, out_equil, out_summ, out_num, out_work \
   324         1    8958798.8 8958798.8     71.9                = jetto(in_prof, in_src, in_trans, in_equil, in_nbi,
   325         1          0.2      0.2      0.0                        in_pel, in_pulse, in_contr, in_summ, in_num, in_work)
   367         1    3459717.4 3459717.4     27.8      out_ids_bundle = bundle_copy(in_ids_bundle_work)
|
Complete file is below:
| View file |
|---|
| name | line_profiler_result.txt |
|---|
| height | 250 |
|---|
|
CPROFILER
| Code Block |
|---|
|
Thu Jul 20 14:45:51 2023    jintrac.prof

         207169007 function calls (178433155 primitive calls) in 153.082 seconds

   Ordered by: internal time

   ncalls  tottime  percall  cumtime  percall filename:lineno(function)
26076870/927   40.886    0.000   83.306    0.090 copy.py:128(deepcopy)
  3356451   22.884    0.000   35.138    0.000 {imas_3_38_1_ual_4_11_3._ual_lowlevel.ual_read_data_array}
778014/927    8.909    0.000   83.288    0.090 copy.py:227(_deepcopy_dict)
  2959395    8.181    0.000    8.181    0.000 {imas_3_38_1_ual_4_11_3._ual_lowlevel.ual_read_data_scalar}
 53709341    6.903    0.000    6.903    0.000 {method 'get' of 'dict' objects}
        1    5.946    5.946    7.387    7.387 wrapper.py:48(jetto_actor)
  4441187    4.289    0.000    4.289    0.000 {method '__deepcopy__' of 'numpy.ndarray' objects}
1556028/927    4.099    0.000   83.298    0.090 copy.py:259(_reconstruct)
  7099231    3.986    0.000    5.677    0.000 copy.py:243(_keep_alive)
 35834998    3.833    0.000    3.833    0.000 {built-in method builtins.id}
  3398693    2.945    0.000    2.945    0.000 {built-in method numpy.zeros}
   987875    2.815    0.000    2.815    0.000 {method 'reduce' of 'numpy.ufunc' objects}
 18974180    2.163    0.000    2.163    0.000 copy.py:182(_deepcopy_atomic)
  1556028    1.704    0.000    1.707    0.000 {method '__reduce_ex__' of 'object' objects}
  8542427    1.672    0.000    1.672    0.000 {built-in method builtins.getattr}
   495951    1.465    0.000    4.334    0.000 fromnumeric.py:69(_wrapreduction)
  1274146    1.441    0.000    1.441    0.000 {method 'items' of 'dict' objects}
   491924    1.422    0.000    3.040    0.000 fromnumeric.py:38(_wrapit)
        1    1.277    1.277  153.141  153.141 jintrac_imas_driver.py:1(<module>)
   987877    1.196    0.000   10.454    0.000 {built-in method numpy.core._multiarray_umath.implement_array_function}
491924 1.001 0.000 1.001 0.000 {method 'reshape' of 'numpy.ndarray' objects} |
Complete file is below:
| View file |
|---|
| name | cprofile_result.txt |
|---|
| height | 250 |
|---|
|
Partial_get vs get
IDS :: Core_profiles
The test is checking the time differences between fetching whole IDS using get and fetching IDS in parts using partial_get .
| Code Block |
|---|
| language | py |
|---|
| title | source code of patial_get vs get test |
|---|
|
import sys
import numpy
import os
import time
import imas

user = os.environ['USER']
imasVersion = os.environ['IMAS_VERSION'][:1]
database = 'test'
backendtype = 'HDF5'
machine_in = "west"

ids_in = imas.DBEntry(13, "west", 54762, 1, user_name="/pfs/work/g2pbloch/jetto/runs/test/imasdb")
ids_in.open()

start_partial = time.time()
rho_tor_norm = ids_in.partial_get("core_profiles" ,"profiles_1d(:)/grid/rho_tor_norm(:)")
core_profiles_profiles_1d_zeff = ids_in.partial_get("core_profiles", "profiles_1d(:)/zeff(:)")
rho_tor_norm = ids_in.partial_get("core_profiles" ,"profiles_1d(:)/grid/rho_tor_norm(:)")
q = ids_in.partial_get("core_profiles" ,"profiles_1d(:)/q(:)")
density_thermal = ids_in.partial_get("core_profiles" ,"profiles_1d(:)/electrons.density_thermal(:)")
temperature = ids_in.partial_get("core_profiles" ,"profiles_1d(:)/electrons/temperature(:)")
ion = ids_in.partial_get("core_profiles" ,"profiles_1d(:)/ion")
t_i_average = ids_in.partial_get("core_profiles" ,"profiles_1d(:)/t_i_average(:)")
zeff = ids_in.partial_get("core_profiles" ,"profiles_1d(:)/zeff(:)")
rotation_frequency_tor_sonic = ids_in.partial_get("core_profiles", "profiles_1d(:)/rotation_frequency_tor_sonic")
end_partial = time.time()

start_get = time.time()
core_profiles = ids_in.get("core_profiles")
end_get = time.time()

print(f"partial_get: {end_partial - start_partial}, get : { end_get - start_get}")
ids_in.close() |
The time gain is small, just below 1 second, for the entire duration of about 24 seconds:
partial_get: 23.91968011856079, get : 24.872377157211304
IDS :: equilibrium
Testing description
I couldn't retrieve the data using, for example: equilibriumtime_sliceitimeglobal_quantitiesip = ids_in.partial_get("equilibrium", "time_slice(:)/global_quantities/ip") because I was getting the following error: ERROR: [time_slice] AoS internal field(s) cannot be returned in non-homogeneous mode for more than one AoS index . Due to this, I had to iterate and retrieve the data for each time separately.
When it comes to get_slice , I retrieve timestamps using partial_get . Then, for each timestamp, I fetch a segment using get_slice and apply imas.imasdef.LINEAR_INTERP interpolation.
| Code Block |
|---|
| language | py |
|---|
| title | partial_get vs get |
|---|
|
import sys
import numpy
import os
import time
import imas
def run():
	user = os.environ['USER']
	imasVersion = os.environ['IMAS_VERSION'][:1]
	database = 'test'
	backendtype = 'HDF5'
	machine_in = "west"
	ids_in = imas.DBEntry(13, "west", 54762, 1, user_name="/pfs/work/g2pbloch/jetto/runs/test/imasdb")
	ids_in.open()
	start_partial = time.time()
	eq_time = ids_in.partial_get("equilibrium", "time(:)")
	equilibriumtime_sliceitimeglobal_quantitiesip  =  [ids_in.partial_get("equilibrium", f"time_slice({i})/global_quantities/ip") for i in range(len(eq_time))]
	equilibriumtime_sliceitimeglobal_quantitiespsi_axis  =  [ids_in.partial_get("equilibrium", f"time_slice({i})/global_quantities/psi_axis") for i in range(len(eq_time))]
	equilibriumtime_sliceitimeglobal_quantitiespsi_boundary  =  [ids_in.partial_get("equilibrium", f"time_slice({i})/global_quantities/psi_boundary") for i in range(len(eq_time))]
	equilibriumtime_sliceitimeglobal_quantitiesmagnetic_axisr  =  [ids_in.partial_get("equilibrium", f"time_slice({i})/global_quantities/magnetic_axis/r") for i in range(len(eq_time))]
	equilibriumtime_sliceitimeglobal_quantitiesmagnetic_axisz  =  [ids_in.partial_get("equilibrium", f"time_slice({i})/global_quantities/magnetic_axis/z") for i in range(len(eq_time))]
	equilibriumtime_sliceitimeprofiles_1drho_tor_norm  =  [ids_in.partial_get("equilibrium", f"time_slice({i})/profiles_1d/rho_tor_norm(:)") for i in range(len(eq_time))]
	equilibriumtime_sliceitimeprofiles_1dpsi  =  [ids_in.partial_get("equilibrium", f"time_slice({i})/profiles_1d/psi(:)") for i in range(len(eq_time))]
	equilibriumtime_sliceitimeboundaryoutliner  =  [ids_in.partial_get("equilibrium", f"time_slice({i})/boundary/outline/r(:)") for i in range(len(eq_time))]
	equilibriumtime_sliceitimeboundarylcfsr  =  [ids_in.partial_get("equilibrium", f"time_slice({i})/boundary/lcfs/r(:)") for i in range(len(eq_time))]
	equilibriumtime_sliceitimeboundaryoutlinez  =  [ids_in.partial_get("equilibrium", f"time_slice({i})/boundary/outline/z(:)") for i in range(len(eq_time))]
	equilibriumtime_sliceitimeboundarylcfsz  =  [ids_in.partial_get("equilibrium", f"time_slice({i})/boundary/lcfs/z(:)") for i in range(len(eq_time))]
	equilibriumtime_sliceitimeprofiles_2d1psi  =  [ids_in.partial_get("equilibrium", f"time_slice({i})/profiles_2d(1)/psi(:)") for i in range(len(eq_time))]
	equilibriumtime_sliceitimeprofiles_2d1griddim1  =  [ids_in.partial_get("equilibrium", f"time_slice({i})/profiles_2d(1)/grid/dim1(:)") for i in range(len(eq_time))]
	equilibriumtime_sliceitimeprofiles_2d1griddim2  =  [ids_in.partial_get("equilibrium", f"time_slice({i})/profiles_2d(1)/grid/dim2(:)") for i in range(len(eq_time))]
	end_partial = time.time()

	start_get = time.time()
	equilibrium = ids_in.get("equilibrium")
	end_get = time.time()
	print(f"partial_get: {end_partial - start_partial}, get : {end_get - start_get}")
	ids_in.close()
if __name__ == "__main__":
run() |
| Code Block |
|---|
|
import sys
import numpy
import os
import time
import imas

def run():
	user = os.environ['USER']
	imasVersion = os.environ['IMAS_VERSION'][:1]
	database = 'test'
	backendtype = 'HDF5'
	machine_in = "west"
	ids_in = imas.DBEntry(13, "west", 54762, 1, user_name="/pfs/work/g2pbloch/jetto/runs/test/imasdb")
	ids_in.open()
	eq_time = ids_in.partial_get("equilibrium", "time(:)")
	get_slice_start = time.time()
	data = [ids_in.get_slice("equilibrium", t, imas.imasdef.LINEAR_INTERP) for t in eq_time]
	get_slice_end = time.time()
	print(get_slice_end-get_slice_start)
if __name__ == "__main__":
run() |
Time result
- partial_get without
profiles_2d : 4.72s - partial_get with
profiles_2d : 9.682.682 ( profiles_2d(1)/psi: 3.6s , profiles_2d(1)/grid/dim1 : 0.76s , profiles_2d(1)/grid/dim2 : 0.7s)
- get : 7.47s
- get_slice : 718 s
September 2024
Partial_get vs get
environment:
| Code Block |
|---|
| language | bash |
|---|
| title | environment |
|---|
|
module use /pfs/work/g2fjc/jintrac/32.0.1/modules/
module load jintrac
export JINTRAC_IMAS_BACKEND=HDF5
module use /pfs/work/g2fjc/cmg/jams/31.0.0/modules
module load jams |
Timing (1D) and (1D+2D) with partial get vs full get. I am using data from /gss_efgw_work/work/g2fjc/jetto/runs/runmemleak_v120523_np1_z0_1ms_hdf5/imasdb/ .
Python code to reproduce:
| Code Block |
|---|
| language | py |
|---|
| title | python code to timing |
|---|
|
import sys
import numpy
import os
import time
import imas
def run():
	user = os.environ['USER']
	imasVersion = os.environ['IMAS_VERSION'][:1]
	database = 'test'
	backendtype = 'HDF5'
	machine_in = "west"
	ids_in = imas.DBEntry(13, "west", 54762, 1, user_name="/pfs/work/g2pbloch/jetto/runs/test/imasdb")
	ids_in.open()
	start_partial = time.time()
	eq_time = ids_in.partial_get("equilibrium", "time(:)")
	equilibriumtime_sliceitimeglobal_quantitiesip  =  [ids_in.partial_get("equilibrium", f"time_slice({i})/global_quantities/ip") for i in range(len(eq_time))]
	equilibriumtime_sliceitimeglobal_quantitiespsi_axis  =  [ids_in.partial_get("equilibrium", f"time_slice({i})/global_quantities/psi_axis") for i in range(len(eq_time))]
	equilibriumtime_sliceitimeglobal_quantitiespsi_boundary  =  [ids_in.partial_get("equilibrium", f"time_slice({i})/global_quantities/psi_boundary") for i in range(len(eq_time))]
	equilibriumtime_sliceitimeglobal_quantitiesmagnetic_axisr  =  [ids_in.partial_get("equilibrium", f"time_slice({i})/global_quantities/magnetic_axis/r") for i in range(len(eq_time))]
	equilibriumtime_sliceitimeglobal_quantitiesmagnetic_axisz  =  [ids_in.partial_get("equilibrium", f"time_slice({i})/global_quantities/magnetic_axis/z") for i in range(len(eq_time))]
	equilibriumtime_sliceitimeprofiles_1drho_tor_norm  =  [ids_in.partial_get("equilibrium", f"time_slice({i})/profiles_1d/rho_tor_norm(:)") for i in range(len(eq_time))]
	equilibriumtime_sliceitimeprofiles_1dpsi  =  [ids_in.partial_get("equilibrium", f"time_slice({i})/profiles_1d/psi(:)") for i in range(len(eq_time))]
	equilibriumtime_sliceitimeboundaryoutliner  =  [ids_in.partial_get("equilibrium", f"time_slice({i})/boundary/outline/r(:)") for i in range(len(eq_time))]
	equilibriumtime_sliceitimeboundaryoutlinez  =  [ids_in.partial_get("equilibrium", f"time_slice({i})/boundary/outline/z(:)") for i in range(len(eq_time))]
	equilibriumtime_sliceitimeprofiles_2d1psi  =  [ids_in.partial_get("equilibrium", f"time_slice({i})/profiles_2d(1)/psi(:)") for i in range(len(eq_time))]
	equilibriumtime_sliceitimeprofiles_2d1griddim1  =  [ids_in.partial_get("equilibrium", f"time_slice({i})/profiles_2d(1)/grid/dim1(:)") for i in range(len(eq_time))]
	equilibriumtime_sliceitimeprofiles_2d1griddim2  =  [ids_in.partial_get("equilibrium", f"time_slice({i})/profiles_2d(1)/grid/dim2(:)") for i in range(len(eq_time))]
	end_partial = time.time()

	start_get = time.time()
	equilibrium = ids_in.get("equilibrium")
	end_get = time.time()
	print(f"partial_get: {end_partial - start_partial}, get : {end_get - start_get}")
	ids_in.close()
if __name__ == "__main__":
	run()
|
Time result 1D(average of 10 measurements):
- partial_get: 3.70s
- full get: 7.15s
Time result 1D+2D(average of 10 measurements):
- partial_get: 8.69s
- full get: 7.17s